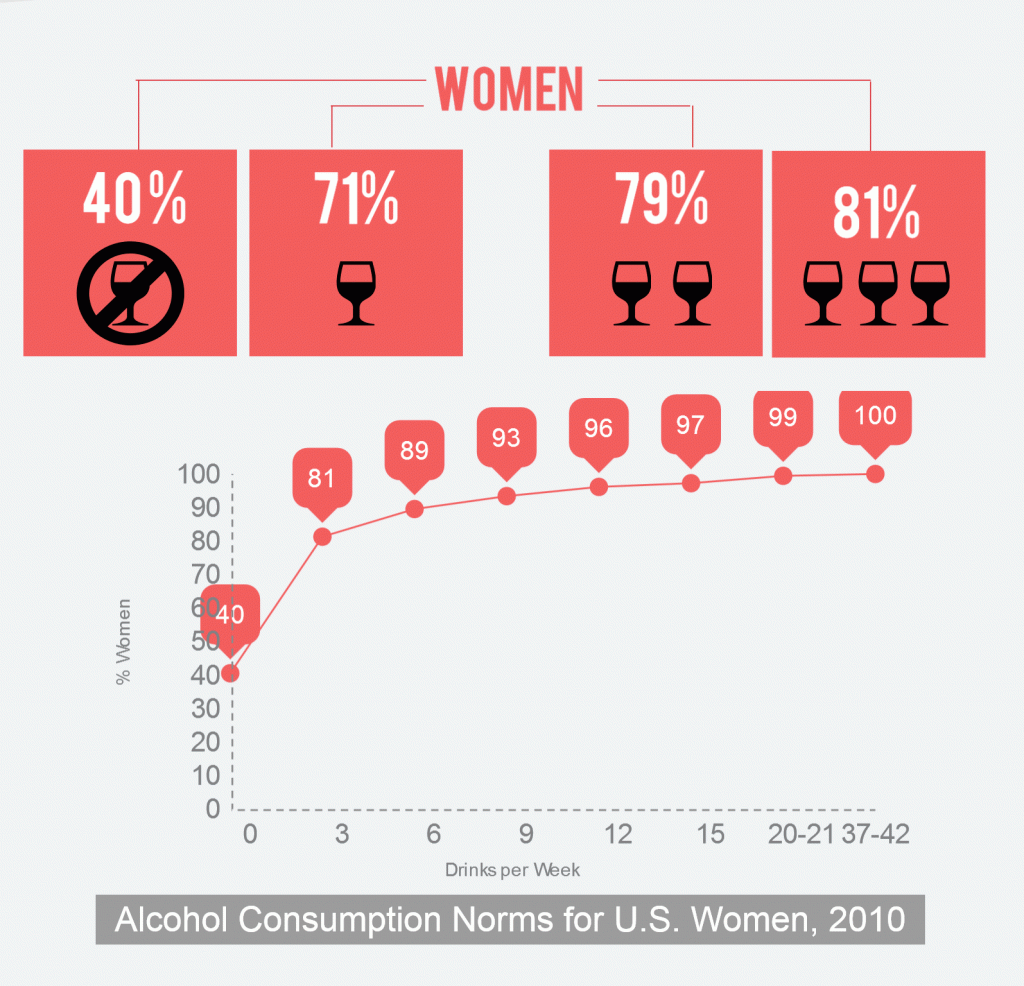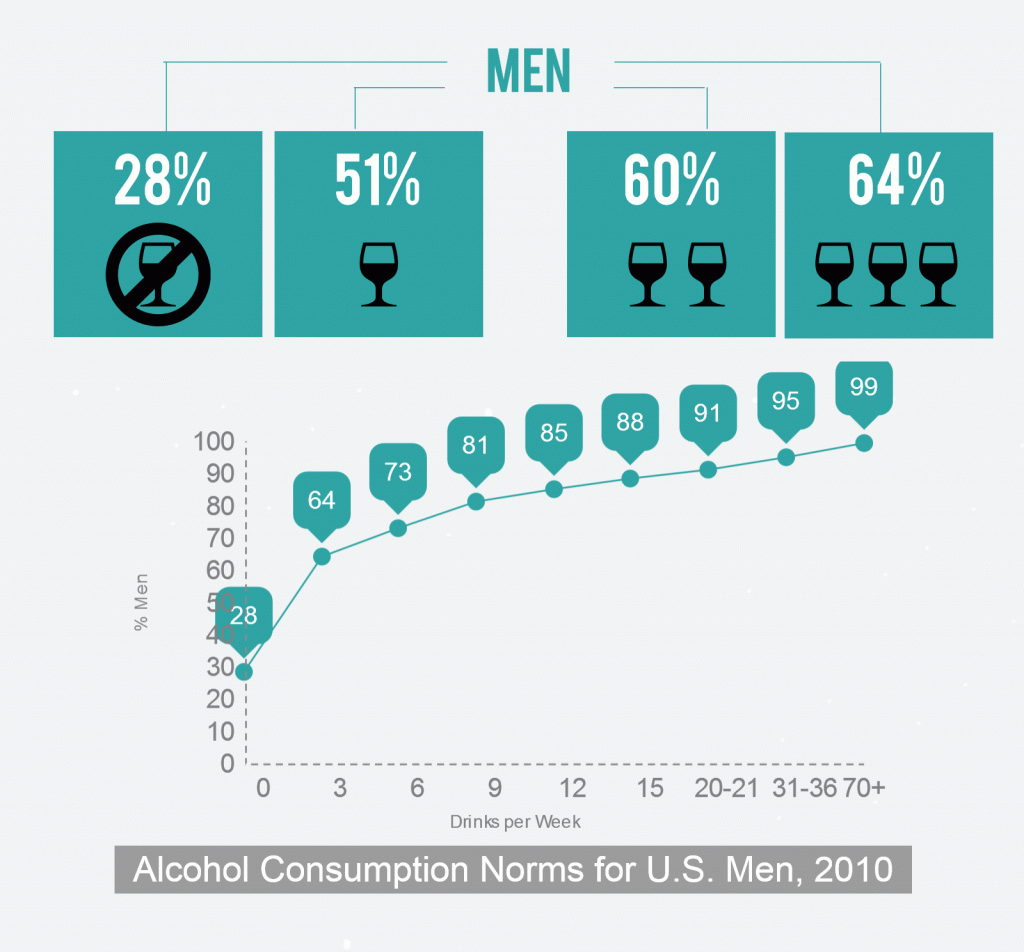

One way to look at your drinking habits is to compare your own consumption level to how much the rest of the nation is drinking. ARG Senior Scientist, Thomas K. Greenfield and Scientist, Yu Ye, took data from the 2010 National Alcohol Survey (NAS) consisting of 7,969 individuals residing in 50 states and Washington DC, and looked at the number of drinks both women and men said they consumed per week on average during the last 12 months.
Take a minute to add up how much you usually drink in a week. You’ll need to think about how many glasses, bottles, or cans of alcoholic beverages you consumed in a typical 7 day period including week days and weekends. You may want to know more about what’s a standard drink and how to measure it.
Once you’ve added up the number of drinks, use the table below to find that number of drinks that matches your own then look at the percentage in the right-hand columns. The percentage tells you the number of women or men out of 100 people drink as much or less than you do.
| # of drinks in a typical week |
% of Women | % of Men |
| 0 (abstainers) | 40 | 28 |
| 1 | 71 | 51 |
| 2 | 79 | 60 |
| 3 | 81 | 64 |
| 4 | 85 | 68 |
| 5 | 88 | 71 |
| 6 | 89 | 73 |
| 7 | 91 | 76 |
| 8 | 93 | 79 |
| 9 | 93 | 81 |
| 10 | 94 | 82 |
| 11 | 95 | 83 |
| 12 | 96 | 85 |
| 13 | 96 | 86 |
| 14 | 97 | 87 |
| 15 | 97 | 88 |
| 16-17 | 98 | 89 |
| 18-19 | 98 | 90 |
| 20-21 | 99 | 91 |
| 22-23 | 99 | 92 |
| 24-26 | 99 | 92 |
| 27-30 | 99 | 94 |
| 31-36 | 99 | 95 |
| 37-42 | 100 | 96 |
| 43-49 | 100 | 97 |
| 50-59 | 100 | 97 |
| 60-69 | 100 | 98 |
| 70+ | 100 | 99 |
As you can see, for men, the drinking norms or the typical number of drinks per week, overall, were higher than for women. Twenty-eight percent of men reported that they abstained from drinking completely (40% of women) during the last 12 months. As another example, about three-quarters (76%) of men report drinking 7 or fewer drinks in a typical week (or one drink a day or less on average) while for women about 91% drink 7 or less drinks/week.
So how does your drinking compare? Are you average or does your drinking place you among the small group drinking more or less than most others in the population? Download the Drinking Norms infographic (PDF) and share it with friends.
Keep in mind that while overall “average volume” of alcohol consumption increases risks of health harms including various types of cancer (Nelson et al., 2013) for risks of social and health harms it is not only your average weekly intake that matters, it is also pattern of drinking. Those who have an average intake of even 7-14 drinks a week but occasionally “binge” (5 or more drinks in a day for men, 4 or more drinks in a day for women) are known to have higher risks of negative health outcomes, including alcohol dependence (Greenfield et al, 2014), injuries and driving under the influence (Cherpitel et al, 2010) and even dying of ischaemic heart disease (IHD; Roerecki et al. 2011), compared to those getting the same average intake by more evenly drinking alcohol in smaller regular amounts (Rehm, Greenfield & Kerr, 2006).
If you do drink, consider drinking a smaller amount overall and never drinking a lot in any one day. Find out more about the low-risk drinking guidelines or for more ideas about changing your drinking pattern, see Miller & Muñoz’s book, Controlling Your Drinking: Tools to Make Moderation Work for You and link to NIAAA’s rethinking drinking.
About the Survey
The survey included 7, 969 individuals with results weighted to the 2010 Census so as to be representative of the US population aged 18 and older. The survey included oversamples of African American and Hispanic respondents and also oversampled low population states.
The 2010 National Alcohol Survey (NAS) was conducted under Center Grant P50 AA05595 (Thomas K. Greenfield, PI; Katherine Karriker-Jaffe, Study Director) from the National Institute on Alcohol Abuse and Alcoholism (NIAAA).
References Cited:
Cherpitel, C.J., Ye, Y., Greenfield, T.K., Bond, J., Kerr, W.C., Midanik, L.T., (2010). Alcohol-related injury and driving while intoxicated: a risk function analysis of two alcohol-related events in the 2000 and 2005 National Alcohol Surveys. The American Journal of Drug and Alcohol Abuse 36, 168-174. Abstract or Full Text.
Dawson, D.A., (2011). Defining risk drinking. Alcohol Res Health 34, 144-156. Full text available.
Greenfield, T.K., Ye, Y., Bond, J., Kerr, W.C., Nayak, M.B., Kaskutas, L.A., Anton, R.F., Litten, R.Z., Kranzler, H.R., (2014). Risks of alcohol use disorders related to drinking patterns in the US general population. J Stud Alcohol Drugs 75, 319-327. Abstract or Full Text.
Kerr, W.C., Stockwell, T., (2012). Understanding standard drinks and drinking guidelines. Drug Alcohol Rev 31, 200-205. Abstract or Full Text.
Miller, W.R., Muñoz, R.F., (2013). Controlling Your Drinking: Tools to make moderation work for you. Guilford Press, New York.
National Institute on Alcoholism and Alcohol Abuse, (2009). Rethinking Drinking: Alcohol and your health [Accessed: 2011-03-02. Archived by WebCite® at https://www.webcitation.org/5wtRANlQ7]. National Institute on Alcoholism and Alcohol Abuse, Bethesda, MD.


